Menu
  • Home
  • Tools

iChrome

+

Plotting Analytical Functions

Examples, Grapheme, Nexus
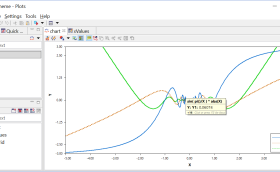
Hi there, this post shows how Grapheme and Nexus GUI tables and charts can be used to evaluate and plot analytical functions. In this example we …
10th June 2016 By iChrome
+
  • 1
  • 2
  • 3
  • 4

Categories

  • Examples
  • FEM
  • Grapheme
  • Info
  • Integration
  • Nexus
  • Optimization
  • Scripting
  • Shaper
  • Tools

Recent Posts

  • Grapheme – Numerical Optimization Capabilities (Part II)
  • Grapheme – Numerical Optimization Capabilities (Part I)
  • Importing Bulk Tables from Files
  • Discovering structural damage via vibration tests?
  • RTM simulation within Shaper

Latest Posts

  • Grapheme – Numerical Optimization Capabilities (Part II)
    Grapheme – Numerical Optimization Capabilities – Part II Contents Introduction The optimization problem The evaluation …
  • Grapheme – Numerical Optimization Capabilities (Part I)
    Grapheme – Numerical Optimization Capabilities – Part I Contents Introduction The Evaluation Panels Bohachevsky Function …
  • Importing Bulk Tables from Files
    This brief post illustrates how to use the API of Grapheme (and Nexus) to bulk …

More About Us:

Blog Disclaimer

All data and information provided on this Blog is for informational purposes only. iChrome Ltd makes no representations as to accuracy, completeness, correctness, suitability, or validity of any information and will not be liable for any errors, omissions, or delays in this information or any losses, injuries, or damages arising from its display or use. All information is provided on an AS-IS basis. Additionally, the opinions expressed by the Bloggers and those providing comments are theirs alone, and do not necessarily reflect the opinions of iChrome Ltd.
iChrome Copyright © 2026. All Rights Reserved
iChrome Ltd. iChrome, Nexus, Shaper, Grapheme and related logos are trademarks of iChrome Ltd. All rights reserved.